Introduction — Challenges in equipment degradation
The downstream oil and gas industry uses multiple equipment setups that show degradation over the course of operational runs. Key equipment that falls under this category include heat exchangers, compressors, pumps, reboilers, and evaporators. Such degrading equipment account for more than 50% of all equipment in a downstream oil and gas plant and play a crucial role in modulating both efficiency and quality. Any significant decline in these may lead to equipment changeover, untimely plant turnarounds, and resulting financial loss. To avoid this, industry researchers have been working to find a solution for monitoring fouling, although accomplishing the same has several challenges:
- Unavailability of all required variables around equipment to perform first principle calculations.
- In cases where first principle calculations can be performed, some key assumptions/approximations have to be made which diminish the accuracy of the model.
- Widely used software tools require both equipment specification and process data for model development. In addition, they require high volumes of data to learn equipment characteristics and may still be unreliable in case of process variation.
- Using multiple univariate or bivariate charts to analyze fouling trend is a tedious task and requires deep process understanding.
ML/AI Approach using Soft Sensors
The advent of Industry 4.0, catapulted by advancement of machine learning (ML) algorithms and its ever-increasing application in oil and gas industry, has enabled use of stored operations data to deploy novel data-based solutions. Using an ML approach to process this data can lead to great success.
Soft sensor framework to model degradation in equipment, primarily focusses on the core idea to develop a multivariate model that learns the correlation among predictor variables and between predictor and dependent variable(s) (fouling indicator). The soft sensor is trained to identify a deviation in the process induced particularly by fouling, muting the effect of various kinds of other normal process variations. Further, the degree of deviation between current and clean data (without fouling) is calculated to assess the severity of fouling.
SOFT SENSOR DEVELOPMENT
Data Acquisition: Data from historical runs of the equipment is acquired. A minimum of one complete run is required. If an important variable is unavailable, a similar, complimentary variable that qualitatively represents the actual variable is adopted.
Data Preparation: Data cleansing is done via process understanding (separating downtime and uptime) and multivariate outlier technique (outlier detection). Subsequently, data is categorized into clean and fouled sections. A section of data is deemed clean when there is minimal or no fouling, whereas a fouled section is considered when there is considerable increase in fouling; this is separated via a threshold.
Feature Engineering: Using dimensionality reduction techniques, latent variables (LVs) are derived to efficiently capture system variability. LVs can be either linear or nonlinear combinations of predictor variables. Predictor variables that have minimal or no effect on equipment performance are discarded.

Model Development: Clean data is divided into train and test sets and multivariate regression analysis is performed on train sets to capture system characteristics. Based on model performance on test sets combined with bias-variance trade-off analysis, optimal model complexity is determined, while achieving the desired accuracy.
The complexity in the model can be introduced in the form of nonlinearity at two levels: developing non-linear combination of variables during feature engineering, or building a non-linear relationship between the predictor and dependent variable(s), or a combination of both. Generally, model development iteration starts with an assumption of linearity and then based on performance, model complexity is increased.
Model Testing: A continuous iteration between model development, feature engineering, and model accuracy is performed until an expected accuracy is attained.
INGENERO’S SOFT SENSOR IN ACTION — HEAT EXCHANGERS
Objective: Ingenero implemented soft sensor to assess fouling in a real time operation that provided insights on rate of DOF and progression in fouling. Furthermore, it also assisted in predicting RUL to ensure an optimized changeover scheduling.
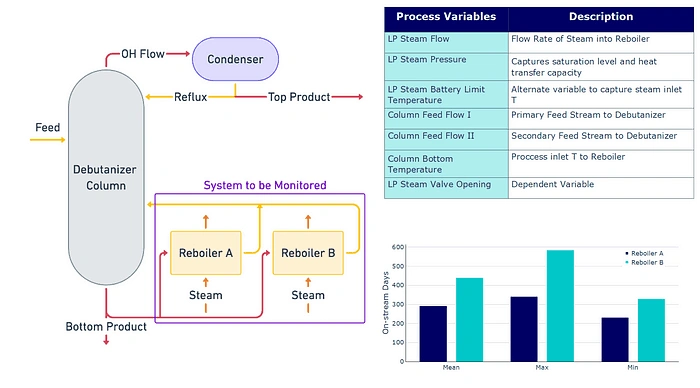
System: To demonstrate the functionality and effectiveness of the Soft Sensor framework, a debutanizer reboiler system is analyzed using the proposed methodology. The block diagram for the process and reboiler system under study is shown in Figure 2. The debutanizer columns under study have two reboilers, A and B, where, at a given instant, a single reboiler is online and the other is in standby. An analysis on run length shows that reboilers A and B have vastly scattered run lengths and it is critical to estimate RUL and fouling progression in these reboilers (Figure 2).
Final Result: This study highlights the various levels of information that can be unlocked via the Soft Sensor framework to monitor, control fouling, and optimize the changeover process.
Results and Discussion:
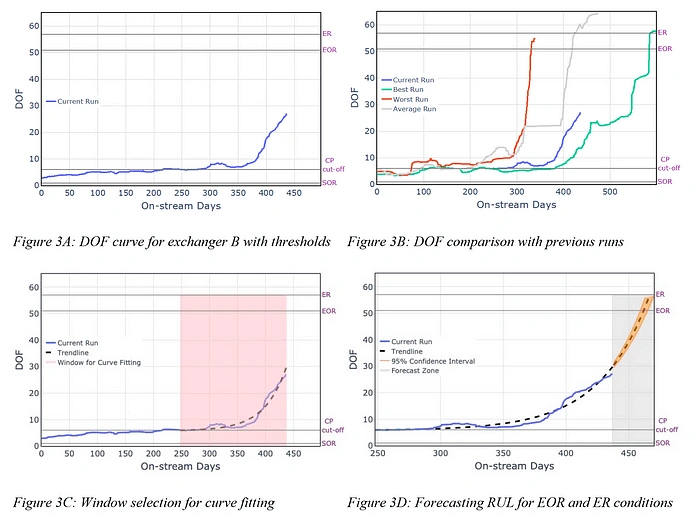
The current discussion focuses on Reboiler B runs for further investigation. Based on Soft Sensor output, a DOF plot for current run is developed and respective thresholds (SOR, CP cut-off, EOR and ER) are marked (Figure 3A). Threshold limits have been estimated statistically and verified from process understanding. DOF does not have a quantitative significance but it qualitatively emulates the progression in equipment fouling. DOF and thresholds will be unique for every system and can be compared across historical runs of the same system (Figure 3B) but not across different systems. Such comparison allows the operator to track the current run relative to historical runs. In Figure 3B, a similar comparison is drawn between reboiler B’s current run and its predecessor runs. At a glance, the quality of current run looks closer to its best run, implying that performance of current run is reasonable.
The DOF curve for reboiler B in Figure 3A, shows a significant increase in DOF post CP cut-off threshold which flattens as it approaches EOR or ER threshold. Performing RUL prediction when the system is in CP (Clean Phase) region will provide an abstract number, therefore, real time monitoring is mainly supported by DOF, rate of DOF, and comparison plots during this period. As the system enters FP (Fouling Phase) region, RUL indicator is brought online to provide an accurate changeover date along with the previously mentioned fouling indicator. Given the intricacy of RUL prediction, a window option for curve fitting is implemented. In Figure 3C, an appropriate window is selected and a best-fit curve (using mean squared error) is selected from the available options of parametric and non-parametric curves.
The best fit trend line is extended till it intersects the EOR and ER threshold (Figure 3D). A 95% confidence interval is adopted to measure the uncertainty around the prediction. A continuous prediction of RUL reported by the Soft Sensor guides the operator to a plan changeover accordingly. In the absence of an RUL predictor, operator tends to opt for an early changeover, incurring unnecessary financial loss.
FEATURES: AUTOMATION, VISUALIZATION AND SCALABILITY
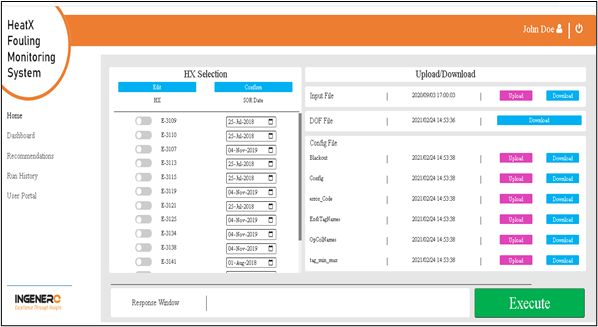
To ensure that the Soft Sensor model is accessible to a wide range of users with and without an analytics background, an intuitive frontend is designed to enhance user experience (Figure 4).
The interface is developed to serve multiple users at a time and it offers an all-round evaluation of the degrading system. The HOME, DASHBOARD, RUN HISTORY, USER PORTAL provides the option to run the Soft Sensor module on the listed system and on the given latest input dataset and allows the user to download previous data/results. Role based login restricts user access to certain files related to module setup. The progression status of the current run of the Soft Sensor, any discrepancy in user provided information or run time error gets highlighted through an error message in the response window.
The developed product has a flexible framework to add new systems with ease. Simultaneously, the overall product and related I/O format are customizable based on user requirements. The Soft Sensor framework and the underlying technique have a broad spectrum of applicability. Although, the case study presented in this article provides information specific to a reboilers, the model can also be extended to other degrading systems like compressors, pumps, all types of process exchangers, and catalysts in catalytic reactors.
CONCLUSION:
The work presented in this paper encapsulates a general “Soft Sensor for fouling” framework that can be implemented to monitor fouling progression in inherently degrading systems. A concept of monotonic variable termed DOF is developed to capture fouling via multivariate linear/nonlinear regression. A multivariate outlook ensures that a fouling induced process shift is isolated from normal operation. The DOF, rate of DOF, DOF comparison (with previous runs), and RUL prediction provides an early fouling indication and run length estimation. An application of the same is presented using a reboiler changeover study, indicating early changeover in the absence of Soft Sensor guidance. At present the Soft Sensor framework has been successfully extended to multiple process systems including charged gas compressors, reboilers, and catalyst degradation. In order to progressively evolve Soft Sensor framework, the techniques underneath the framework are being refined with feedback from users and self-testing to increase its robustness. Similarly, common customization requirements from users are being absorbed into base product. Depending on the process complexities, alternate algorithms for model building and RUL prediction are being explored to improve accuracy, performance, and reliability of Soft Sensors.
Suggested Read: What Is Edge AI
FAQs on Soft Sensor Technology
What is soft sensor technology in heat exchangers?
Soft sensor technology is a way to monitor how a heat exchanger is performing without adding new physical sensors. Instead, it uses data the plant is already collecting—like temperatures and flow rates—and runs it through smart models to estimate things like fouling. It’s like having a digital assistant that helps keep an eye on performance.
How does fouling affect heat exchanger performance in oil and gas plants?
When fouling builds up inside a heat exchanger, it slows things down. Heat doesn’t transfer as efficiently, which means the equipment has to work harder. This can increase energy use, reduce throughput, and even lead to unexpected shutdowns if not addressed in time.
Why are traditional methods of fouling detection in exchangers insufficient?
Old-school methods often rely on periodic checks or manual inspections, which can miss early signs of trouble. By the time fouling is noticeable, it might already be affecting performance. Plus, stopping equipment to check it isn’t always practical.
How does machine learning improve fouling detection in heat exchangers?
Machine learning helps spot patterns in how equipment behaves over time. By analyzing lots of data, it can pick up on small changes that may point to early fouling. That way, issues can be caught and fixed sooner, before they become big problems.
What is Degree of Fouling (DOF) and how is it calculated in soft sensors?
DOF is a way to measure how much a heat exchanger’s efficiency has dropped due to fouling. Soft sensors calculate it by comparing how the equipment is performing now to how it performed when it was clean. The bigger the difference, the higher the DOF.
How can soft sensors help predict Remaining Useful Life (RUL) of exchangers?
Soft sensors can look at how performance is changing over time and estimate how long the equipment can keep running before it needs cleaning or maintenance. This helps with planning and avoids unexpected breakdowns.
What data is required to develop a soft sensor for heat exchangers?
You don’t need anything fancy—just data that most plants already have. Things like inlet/outlet temperatures, flow rates, and pressures are enough. With this, a soft sensor model can be built and start giving insights.
What is the difference between hard sensor and soft sensor?
A hard sensor is a physical device attached to equipment—it measures something directly. A soft sensor doesn’t measure anything physically. Instead, it uses software and data to estimate things, kind of like a digital model doing the math in the background.
What are the benefits of Ingenero’s soft sensor framework in downstream oil and gas?
Ingenero’s soft sensor setup helps plants run more efficiently. It flags issues early, improves maintenance planning, and cuts down on energy waste. The best part? You don’t need to install new sensors or shut anything down—it works with the data you already have.
How accurate is soft sensor-based RUL prediction compared to traditional methods?
Soft sensors tend to be more accurate because they constantly update based on live data. Traditional methods are often based on fixed estimates or time intervals. With soft sensors, predictions adjust as conditions change, giving you better visibility into what’s really happening.